

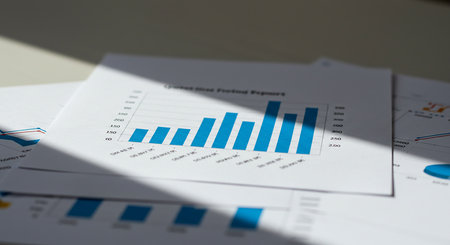
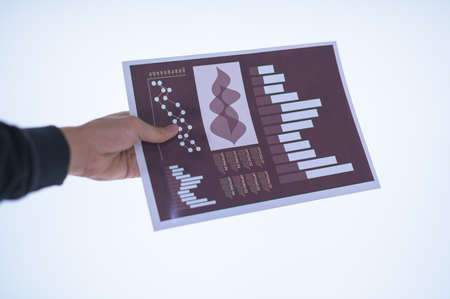
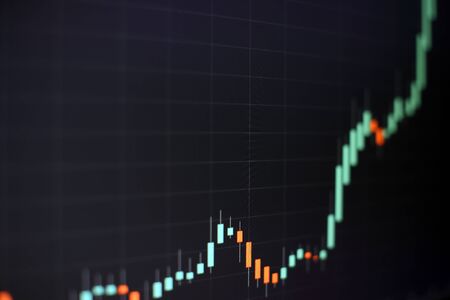
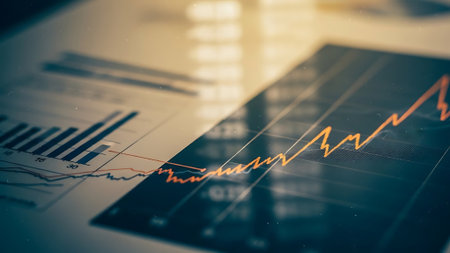
Shallow depth of field (selective focus) with details of a chart showing the stock market crash from March 2020 due to the Covid-19 pandemic on a computer screen (S&P500 index)
Коллекция по умолчанию
Коллекция по умолчанию
Создать новую
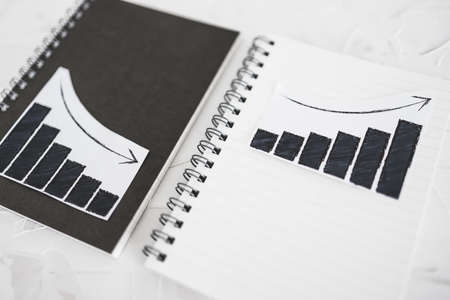
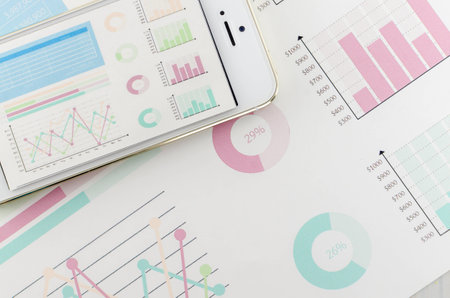
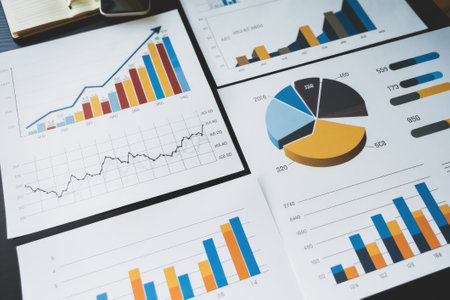
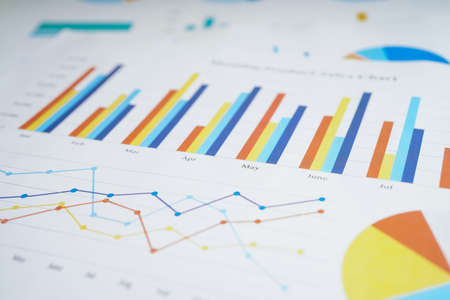
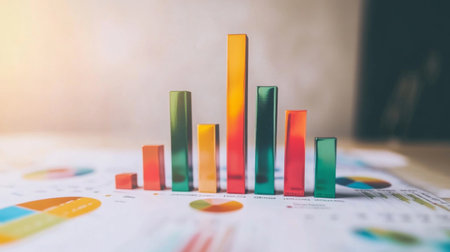
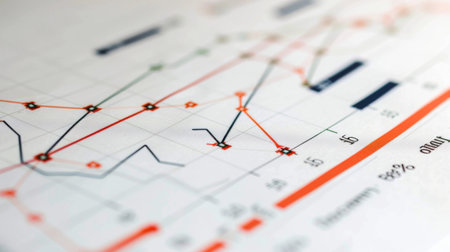
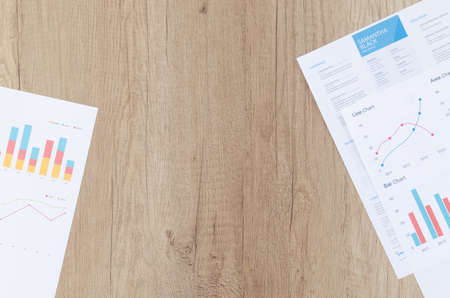
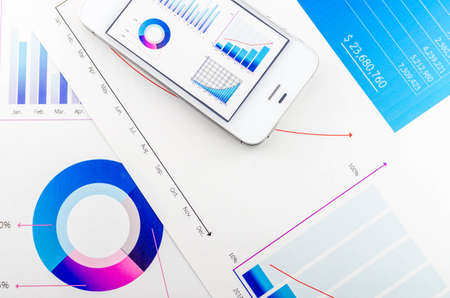
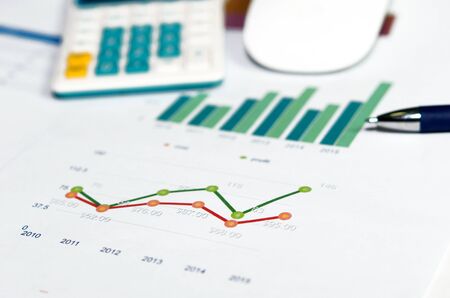
business analysis and statistics concept, positive and negative trends on graphs on notebooks side by side
Коллекция по умолчанию
Коллекция по умолчанию
Создать новую
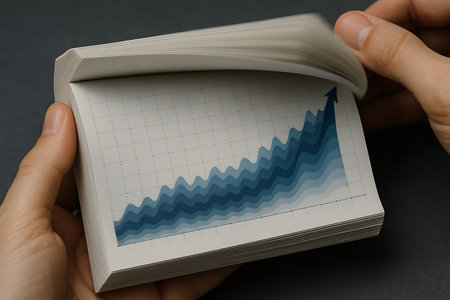
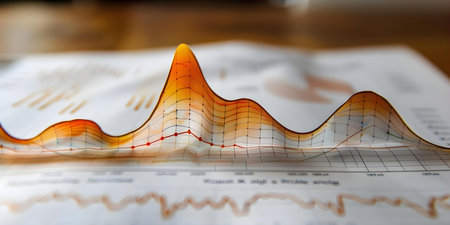
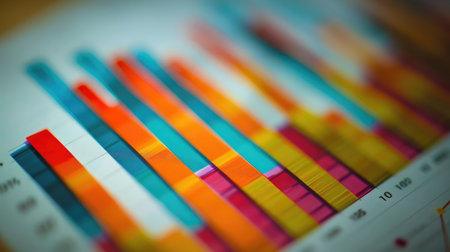
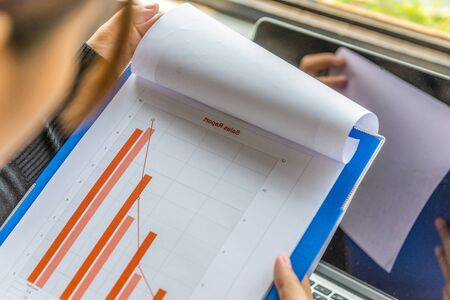
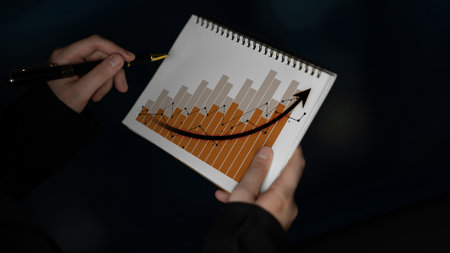
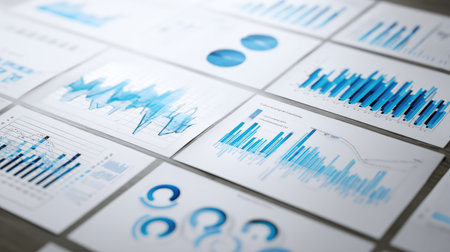
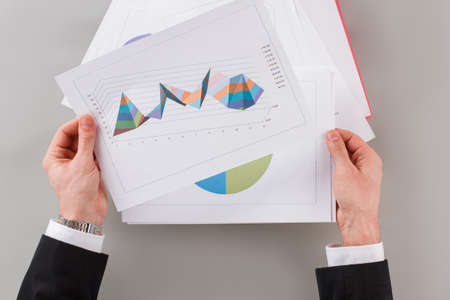
Close-up of hands holding and flipping through a flipbook, revealing a dynamic area graph depicting an upward trend. The layered blue chart signifies continuous business growth, financial progress, and positive market development. This visual metaphor represents progression, success, and the visualization of data over time, ideal for concepts related to finance, economy, investment, and strategic planning.
Коллекция по умолчанию
Коллекция по умолчанию
Создать новую

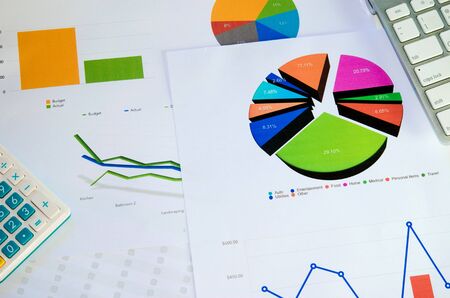
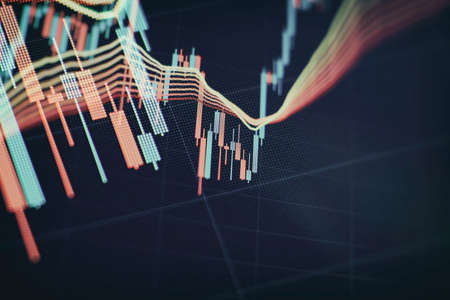
ballpoint pen indicates income graphs lying on the table
Коллекция по умолчанию
Коллекция по умолчанию
Создать новую

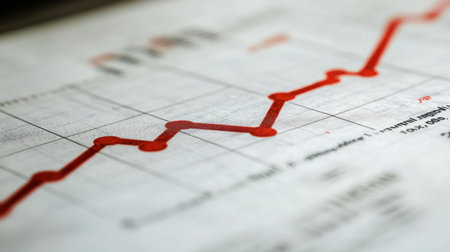
Line graph on desk and pen. Vintage filter
Коллекция по умолчанию
Коллекция по умолчанию
Создать новую

Virus pandemic covid-19 map on pc screen, global infection, internet.
Коллекция по умолчанию
Коллекция по умолчанию
Создать новую

This image features an abstract design of financial graphs and charts in 3D, showcasing creative shapes with green and white tones for data visualization.
Коллекция по умолчанию
Коллекция по умолчанию
Создать новую
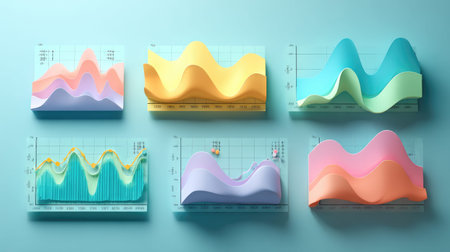
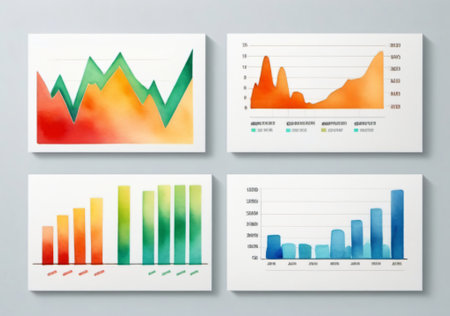
Vibrant and modern data visualization featuring colorful mathematical graphs and smooth abstract shapes presented on a bright background, ideal for creative projects.
Коллекция по умолчанию
Коллекция по умолчанию
Создать новую
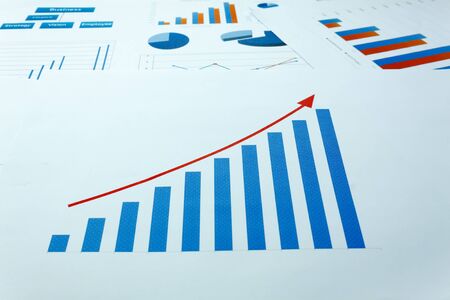
business background grown up concept the business chart document background.
Коллекция по умолчанию
Коллекция по умолчанию
Создать новую

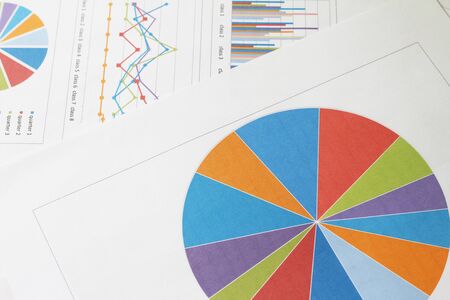
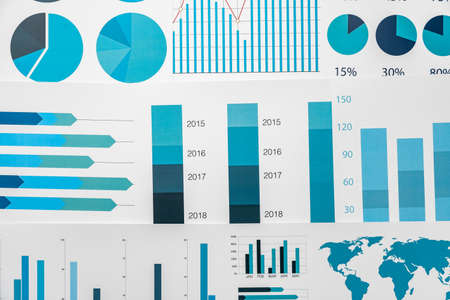
Many type of infographic diagram over white background. Top view.
Коллекция по умолчанию
Коллекция по умолчанию
Создать новую

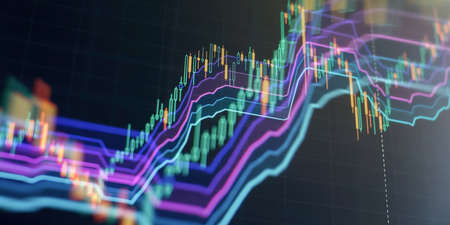
Financial instruments with various types of indicators including volume analysis for professional technical analysis
Коллекция по умолчанию
Коллекция по умолчанию
Создать новую
Financial paper with charts and diagrams on gray table
Коллекция по умолчанию
Коллекция по умолчанию
Создать новую
Analyzing Stock Market Trends and Investment Opportunities: A Detailed Financial Chart. Concept Stock Market Trends, Investment Opportunities, Financial Charts, Analysis, Detailed Insights
Коллекция по умолчанию
Коллекция по умолчанию
Создать новую
Analytic chart element, colorful infographics. Business statistic, diagram, data visualization, graph information.
Коллекция по умолчанию
Коллекция по умолчанию
Создать новую

Radiated emissions spectrogram with limit lines in EMC electromagnetic compatibility test report
Коллекция по умолчанию
Коллекция по умолчанию
Создать новую

Stock market or forex trading graph in graphic concept suitable for financial investment or Economic trends business idea and all art work design.
Коллекция по умолчанию
Коллекция по умолчанию
Создать новую
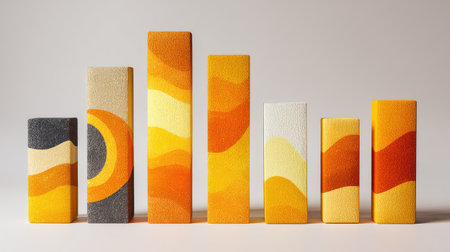
A vibrant arrangement of textured blocks showcases a playful blend of warm colors, including yellow, orange, and gray. The shapes create a modern, artistic expression.
Коллекция по умолчанию
Коллекция по умолчанию
Создать новую
Set of business card templates with colorful graphs and charts. Vector illustration.
Коллекция по умолчанию
Коллекция по умолчанию
Создать новую
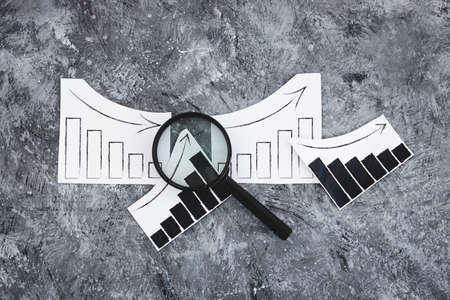
financial markets or money and investments conceptual image, magnifying glass with charts showing upward and downward trends
Коллекция по умолчанию
Коллекция по умолчанию
Создать новую
Stock market business graph chart on digital screen
Коллекция по умолчанию
Коллекция по умолчанию
Создать новую
Business table with bar chart graphs.
Коллекция по умолчанию
Коллекция по умолчанию
Создать новую
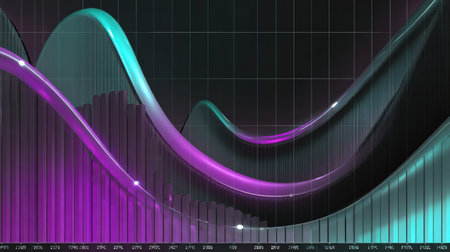
This abstract image features dynamic financial charts with colorful lines and curves, representing market trends. Ideal for finance and analysis projects.
Коллекция по умолчанию
Коллекция по умолчанию
Создать новую
Graphs
Коллекция по умолчанию
Коллекция по умолчанию
Создать новую
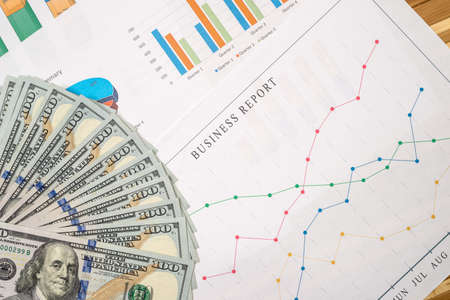
A close-up of a business report with colorful bar and line graphs.
Коллекция по умолчанию
Коллекция по умолчанию
Создать новую

analysis for professional technical analysis on the monitor of a computer.
Коллекция по умолчанию
Коллекция по умолчанию
Создать новую
Finance and accounting business, business planing, accounting
Коллекция по умолчанию
Коллекция по умолчанию
Создать новую
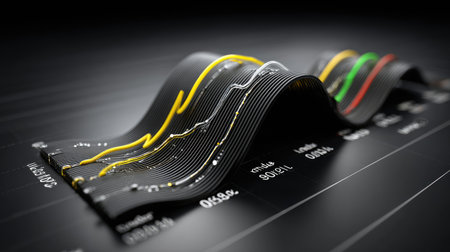
Image of financial data processing, two lines with glowing spot on grid. global business finance concept digitally generated image.
Коллекция по умолчанию
Коллекция по умолчанию
Создать новую

Conceptual image of a business graph made of white wooden cylinders
Коллекция по умолчанию
Коллекция по умолчанию
Создать новую

interest rates text and graph showing cost of financing going up next real estate value going down, concept of the global economy after the covid-19 pandemic
Коллекция по умолчанию
Коллекция по умолчанию
Создать новую

Futuristic abstract background with colorful graphs and mountains. 3d render
Коллекция по умолчанию
Коллекция по умолчанию
Создать новую
Business documents showing positive growth and financial success through charts and graphs
Коллекция по умолчанию
Коллекция по умолчанию
Создать новую

image of the financial graph on a computer monitor.
Коллекция по умолчанию
Коллекция по умолчанию
Создать новую
The dynamics of changes in currencies. Price growth chart and economic recovery
Коллекция по умолчанию
Коллекция по умолчанию
Создать новую

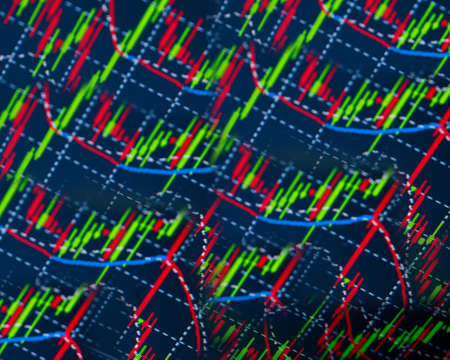
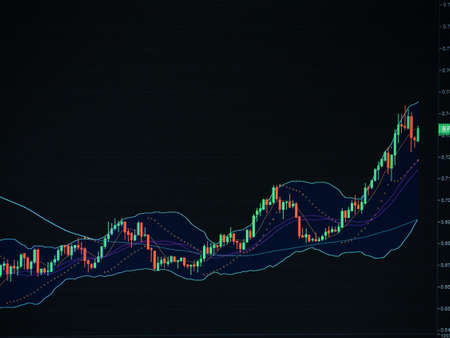
Trading graph and candlestick chart suitable for financial investment concept. Economy trends background for business idea
Коллекция по умолчанию
Коллекция по умолчанию
Создать новую
Image of financial connections over grey background. Global connections, data processing and digital interface concept digitally generated image.
Коллекция по умолчанию
Коллекция по умолчанию
Создать новую
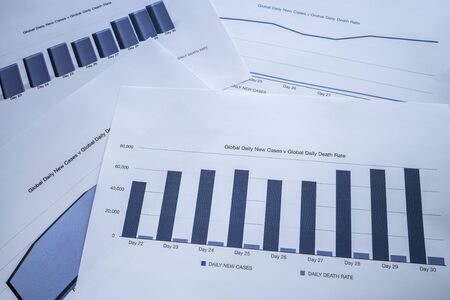
Coronavirus pandemic global daily infections rate vs daily death rate charts visualisation.Photo of charts on table. Infectious diseases curve worldwide. Data analytics medical data
Коллекция по умолчанию
Коллекция по умолчанию
Создать новую
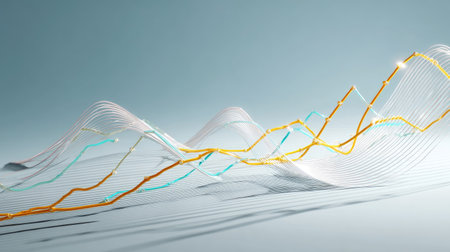
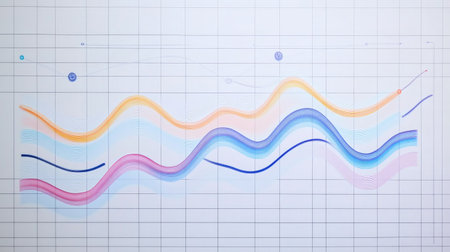
This abstract image showcases flowing wave patterns in a vibrant orange gradient, perfect for concepts related to technology, data analysis, and creative design.
Коллекция по умолчанию
Коллекция по умолчанию
Создать новую
Woman hand holding sales statistic diagram document
Коллекция по умолчанию
Коллекция по умолчанию
Создать новую
many different business graph with calculator and pen on desk.
Коллекция по умолчанию
Коллекция по умолчанию
Создать новую

Image of financial data processing over cityscape. Global finance, business, connections, computing and data processing concept digitally generated image.
Коллекция по умолчанию
Коллекция по умолчанию
Создать новую
graph chart of stock market investment trading.
Коллекция по умолчанию
Коллекция по умолчанию
Создать новую
Indicators including volume analysis for professional technical analysis on the monitor of a computer. Fundamental and technical analysis concept.
Коллекция по умолчанию
Коллекция по умолчанию
Создать новую
business graph with us dollar, close up
Коллекция по умолчанию
Коллекция по умолчанию
Создать новую

Close-up of a stock market analysis chart with a mix of bar graphs and line graphs highlighting key data
Коллекция по умолчанию
Коллекция по умолчанию
Создать новую
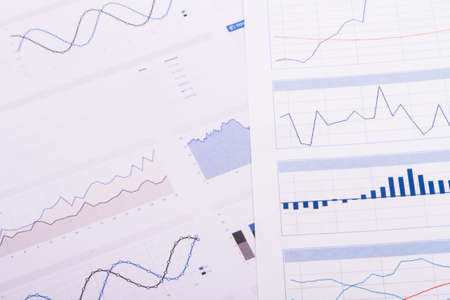
Charts Graphs paper. Financial development, Banking Account, Statistics, Investment Analytic research data economy, Stock exchange Business office company meeting concept.
Коллекция по умолчанию
Коллекция по умолчанию
Создать новую
Financial paper with charts and diagrams on gray table
Коллекция по умолчанию
Коллекция по умолчанию
Создать новую

Business chart with line graph, bar chart and numbers on dark background, 3d rendering. Computer digital drawing.
Коллекция по умолчанию
Коллекция по умолчанию
Создать новую

Data analyzing in Forex, Commodities, Equities, Fixed Income and Emerging Markets: the charts and summary info show about Business statistics and Analytics value - Wealth management concept.
Коллекция по умолчанию
Коллекция по умолчанию
Создать новую
Business screen stock exchange data graph background
Коллекция по умолчанию
Коллекция по умолчанию
Создать новую
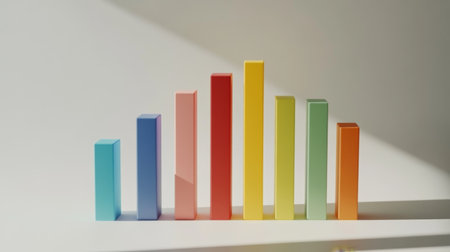
A vibrant arrangement of colorful wooden blocks illustrating growth and progress. This image can be used in business, education, or creativity themes.
Коллекция по умолчанию
Коллекция по умолчанию
Создать новую
Colorful wave patterns and bars depicting data trends in a modern and artistic representation of analytics and information visualization techniques.
Коллекция по умолчанию
Коллекция по умолчанию
Создать новую
Graphic icons set. UI and UX. Premium quality symbol collection. Graphic icon set simple elements for using in app, print, software etc
Коллекция по умолчанию
Коллекция по умолчанию
Создать новую

Charts Graphs paper. Financial development, Banking Account, Statistics, Investment Analytic research data economy, Stock exchange Business office company meeting concept.
Коллекция по умолчанию
Коллекция по умолчанию
Создать новую

Futuristic business graph and chart on blurred background. 3D rendering
Коллекция по умолчанию
Коллекция по умолчанию
Создать новую
D line graph with multiple colored trend lines going upwards, set on a financial data dashboard with subtle grid lines and icons
Коллекция по умолчанию
Коллекция по умолчанию
Создать новую
financial charts and graphs on the table of the businessman, business concept
Коллекция по умолчанию
Коллекция по умолчанию
Создать новую
Hands holding a notepad featuring a bar graph and a rising arrow that symbolize growth and progress in business or financial analysis against a dark background.
Коллекция по умолчанию
Коллекция по умолчанию
Создать новую
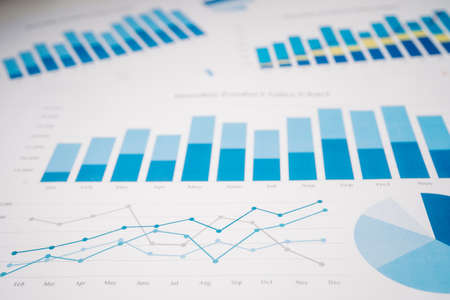
Chart graph paper. Financial development, Banking Account, Statistics, Investment Analytic research data economy, trading, Business company concept.
Коллекция по умолчанию
Коллекция по умолчанию
Создать новую
A detailed close-up of a business bar graph with glossy bars, showcasing performance metrics, against a light background with soft focus elements for a professional look.
Коллекция по умолчанию
Коллекция по умолчанию
Создать новую
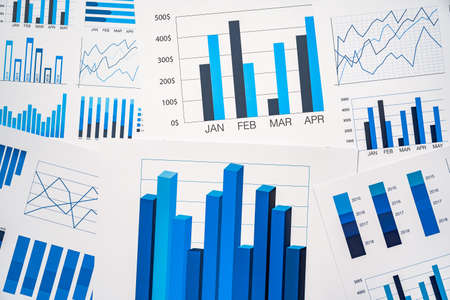
Explore an aerial view of detailed analytical reports showcasing various graphs and charts in blue tones, arranged on a wooden surface for business insights.
Коллекция по умолчанию
Коллекция по умолчанию
Создать новую
market analyze. Bar graphs, Diagrams, financial figures. Abstract glowing forex chart interface wallpaper. Investment, trade, stock, finance
Коллекция по умолчанию
Коллекция по умолчанию
Создать новую

Financial paper charts and graphs on the table.Business Concept
Коллекция по умолчанию
Коллекция по умолчанию
Создать новую

Close-up Of Two Different Colorful Charts On Laptop Keypad
Коллекция по умолчанию
Коллекция по умолчанию
Создать новую
A close-up of a line graph showing financial growth trends over time
Коллекция по умолчанию
Коллекция по умолчанию
Создать новую
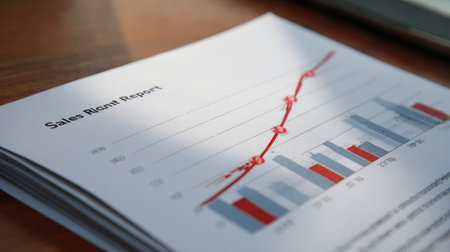
Sales report document showing upward trend line and positive revenue projections
Коллекция по умолчанию
Коллекция по умолчанию
Создать новую

Financial paper charts and graphs on the table
Коллекция по умолчанию
Коллекция по умолчанию
Создать новую
analyzing report, business performance concept
Коллекция по умолчанию
Коллекция по умолчанию
Создать новую
Graph document on a black table
Коллекция по умолчанию
Коллекция по умолчанию
Создать новую
Businessman hand holding a document. Scenes white background.
Коллекция по умолчанию
Коллекция по умолчанию
Создать новую
Workplace on wooden table with graph papers
Коллекция по умолчанию
Коллекция по умолчанию
Создать новую
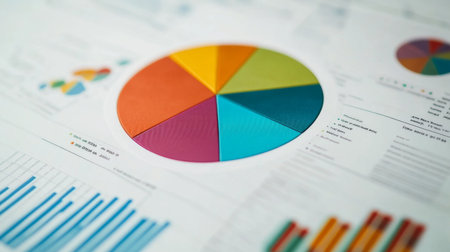
A colorful financial pie chart showing market shares, with labeled sections representing stocks, bonds, and investments, displayed on a white background with clean lines.
Коллекция по умолчанию
Коллекция по умолчанию
Создать новую
Businessman reviewing data in financial charts and graphs. Male hands holding documents with statistics information. Accounting concept.
Коллекция по умолчанию
Коллекция по умолчанию
Создать новую

Office workplace table with charts report on wooden clipboard, glasses and pen.
Коллекция по умолчанию
Коллекция по умолчанию
Создать новую

This abstract illustration features a colorful data wave with dynamic lines, representing the flow of information in modern digital landscapes. An eye-catching design.
Коллекция по умолчанию
Коллекция по умолчанию
Создать новую
Close-up of a business chart showing a rising trend line, symbolizing growth and progress in financial performance. Ideal for economic insights.
Коллекция по умолчанию
Коллекция по умолчанию
Создать новую
Data analyzing from charts and graph to find out the result in the trading market.
Коллекция по умолчанию
Коллекция по умолчанию
Создать новую
Business or Financial Reference: Displaying stock market data, stock exchange or chart on a monitor, stock market chart, stock exchange or chart. stock market investment trading chart.
Коллекция по умолчанию
Коллекция по умолчанию
Создать новую
A detailed 3D rendering of data visualization, showcasing complex information analysis and processing.
Коллекция по умолчанию
Коллекция по умолчанию
Создать новую
Economic graph with diagrams on the stock market, for business and financial concepts and reports.
Коллекция по умолчанию
Коллекция по умолчанию
Создать новую

Business plan documents and charts for eco-tourism startup on rustic wooden table
Коллекция по умолчанию
Коллекция по умолчанию
Создать новую
Graphs and phone
Коллекция по умолчанию
Коллекция по умолчанию
Создать новую

Annual business report. Accountability paperwork. Hands holding a heap of documents with graphs and statistics
Коллекция по умолчанию
Коллекция по умолчанию
Создать новую
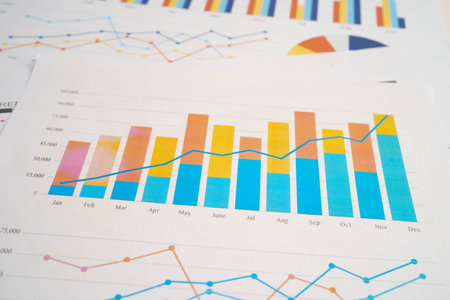
Chart graph paper. Finance, account, statistic, investment data economy, stock exchange business.
Коллекция по умолчанию
Коллекция по умолчанию
Создать новую

business analysis and statistics concept, desk with mixed graphs and charts on clipboard
Коллекция по умолчанию
Коллекция по умолчанию
Создать новую
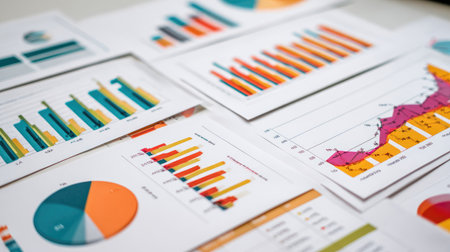
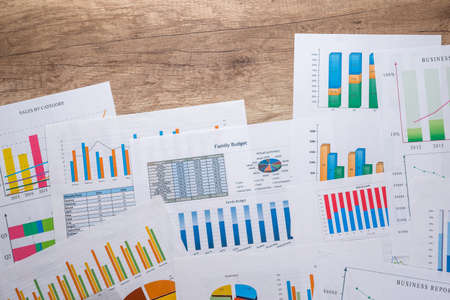
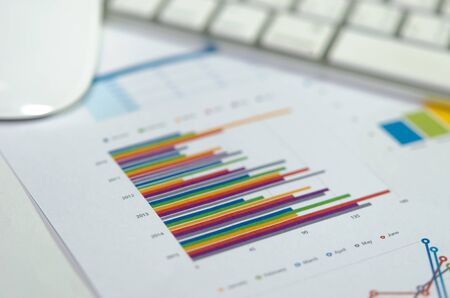
A collection of colorful graphs and charts displayed on papers, representing key business data for effective analysis and presentation in a professional setting.
Коллекция по умолчанию
Коллекция по умолчанию
Создать новую
This vibrant abstract image showcases data trends through dynamic waveforms and bar graphs. Ideal for presentations, reports, and showcasing analytics in various fields.
Коллекция по умолчанию
Коллекция по умолчанию
Создать новую

abstract background, 3d illustration, can be used as a background
Коллекция по умолчанию
Коллекция по умолчанию
Создать новую

Abstract representation of growth with orange peaks on a white background, symbolizing progress and innovation.
Коллекция по умолчанию
Коллекция по умолчанию
Создать новую

3d render graph over gray background, rainbow business infographic, panoramic layout
Коллекция по умолчанию
Коллекция по умолчанию
Создать новую
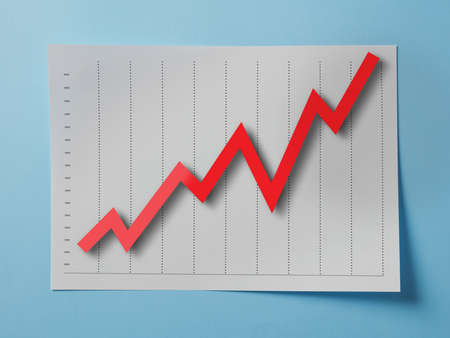
Growing chart on A4 page on blue background
Коллекция по умолчанию
Коллекция по умолчанию
Создать новую

Fundamental and technical analysis concept.
Коллекция по умолчанию
Коллекция по умолчанию
Создать новую

A multi-hued building with numerous windows stands out in vibrant colors against the surrounding cityscape, Colorful bar graphs displaying sales data, AI Generated
Коллекция по умолчанию
Коллекция по умолчанию
Создать новую
Red growth arrow on blue background. Arrow graph going up. The economic growth
Коллекция по умолчанию
Коллекция по умолчанию
Создать новую
on the chalkboard sign woman, man graphic, sexually active, frigid
Коллекция по умолчанию
Коллекция по умолчанию
Создать новую

An image showcases an abstract chart composed of blue and white bars, likely representing data. The background is a blurred map with soft lighting, suggesting a global context. The composition emphasizes a modern, digital aesthetic, suitable for presentations or marketing materials. It could be used in business, finance or data analysis contexts.
Коллекция по умолчанию
Коллекция по умолчанию
Создать новую
documents on office table with laptop computer and graph financial with social network diagram - Filter vintage
Коллекция по умолчанию
Коллекция по умолчанию
Создать новую
Stock market or forex trading graph and candlestick chart suitable for financial investment concept. Economy trends background for business idea and all art work design. Abstract finance background.
Коллекция по умолчанию
Коллекция по умолчанию
Создать новую
Business data elements bar pie charts diagrams and graphs. 3d rendering
Коллекция по умолчанию
Коллекция по умолчанию
Создать новую
financial charts on the table with calculator and pen.
Коллекция по умолчанию
Коллекция по умолчанию
Создать новую

Financial paper with charts and diagrams on gray table
Коллекция по умолчанию
Коллекция по умолчанию
Создать новую
Legion-Media
Создайте свои проекты на основе качественных стоковых фотографий и видео.


Copyright © Legion-Media.